Translating Python Part 1 - Xgboost with Time-Series

xgboost
tidymodel
Author

Francois de Ryckel

Published

October 1, 2022

Modified

October 1, 2022

This post is about using xgboost on a time-series using both R with the tidymodel framework and python. It is part of a series of articles aiming at translating python timeseries blog articles into their tidymodels equivalent.

The raw data is quite simple as it is energy consumption based on an hourly consumption. Original article can be found here. Minimal changes were made to better fit current python practices.

Xgboost is part of the ensemble machine learning algorithms. It can be used for both regression and classification. There are few issues in using Xgboost with time-series. This article is taking a Xgboost post in python and also translating with the new R tidymodel framework.

Loading data and features engineering

Using R

# setting up main R libraries to start 

library(glue)
library(readr)
library(dplyr)
library(ggplot2)
df0 <- read_csv("../../../raw_data/AEP_hourly.csv")
# let's have a quick look at what we are dealing with
glimpse(df0)
Rows: 121,273
Columns: 2
$ Datetime <dttm> 2004-12-31 01:00:00, 2004-12-31 02:00:00, 2004-12-31 03:00:0…
$ AEP_MW   <dbl> 13478, 12865, 12577, 12517, 12670, 13038, 13692, 14297, 14719…

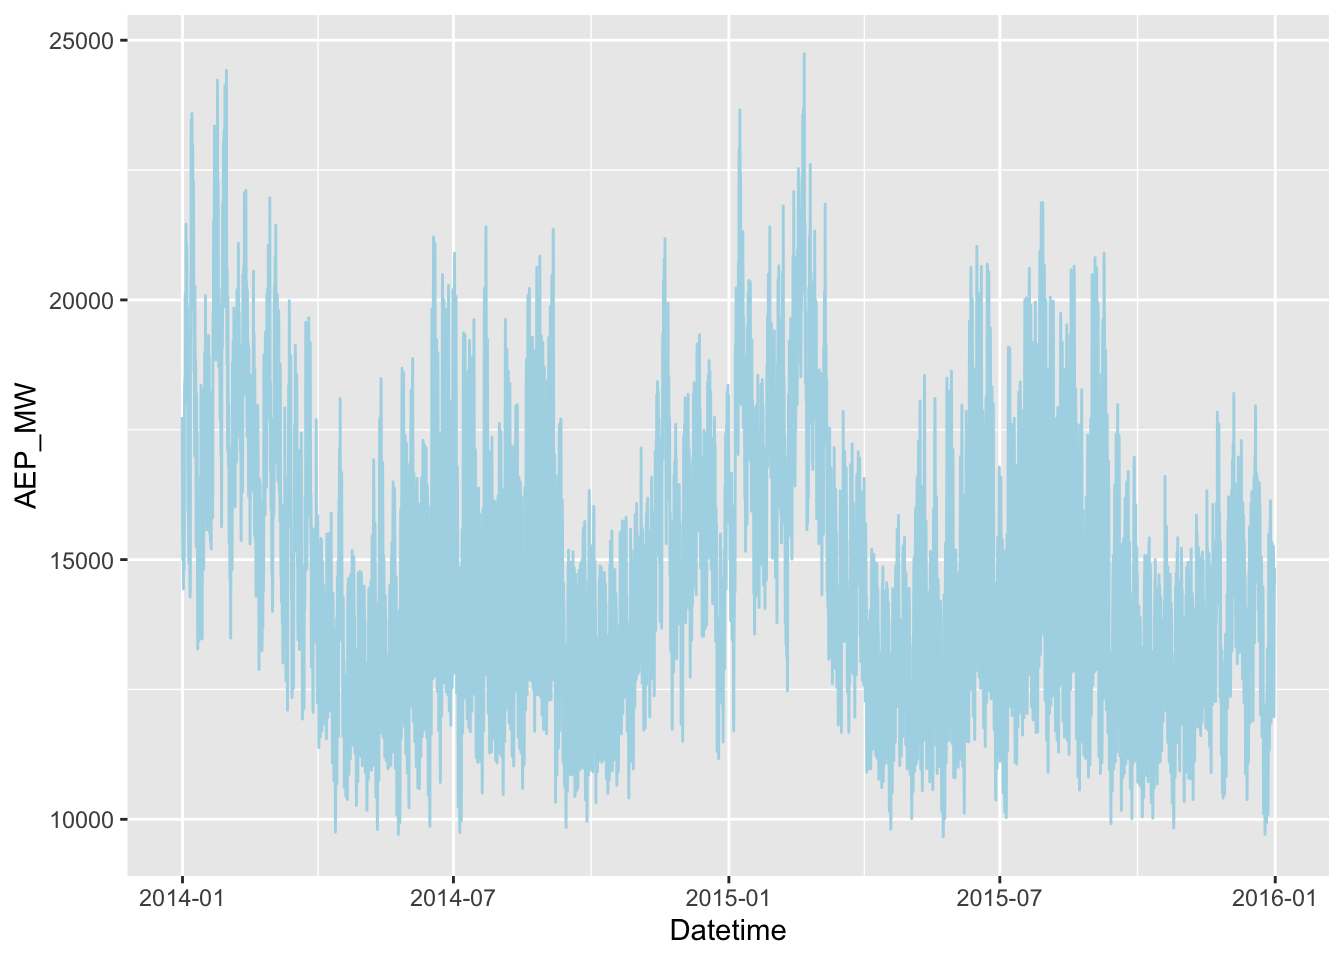
There are only 2 variables. The Datetime being the only independ variable. And the energy consumption labelled as AEP_MW being our variable to predict.

# and graphically - 
# just using a couple of years to get an idea 
ggplot(df0 |> filter(Datetime > "2014-01-01" & Datetime < "2016-01-01"), aes(x =Datetime, y=AEP_MW )) + geom_line(color = "light blue")
Figure 1: Graphical glimpse of our raw data

As Datetime is our only input variable, we’ll use the usual tricks of breaking it down into week number, months, etc. I am doing it slightly differently than in the python version here as I will first create the new time related variables then I will split it into training and testing.

library(lubridate)
df <- df0 |> 
  mutate(hour = hour(Datetime), 
         day_of_week = wday(Datetime), 
         day_of_year = yday(Datetime), 
         day_of_month = mday(Datetime), 
         week_of_year = isoweek(Datetime), 
         month = month(Datetime), 
         quarter = quarter(Datetime), 
         year = isoyear(Datetime)
         ) 
# another glimpse now. 
glimpse(df)
Rows: 121,273
Columns: 10
$ Datetime     <dttm> 2004-12-31 01:00:00, 2004-12-31 02:00:00, 2004-12-31 03:…
$ AEP_MW       <dbl> 13478, 12865, 12577, 12517, 12670, 13038, 13692, 14297, 1…
$ hour         <int> 1, 2, 3, 4, 5, 6, 7, 8, 9, 10, 11, 12, 13, 14, 15, 16, 17…
$ day_of_week  <dbl> 6, 6, 6, 6, 6, 6, 6, 6, 6, 6, 6, 6, 6, 6, 6, 6, 6, 6, 6, …
$ day_of_year  <dbl> 366, 366, 366, 366, 366, 366, 366, 366, 366, 366, 366, 36…
$ day_of_month <int> 31, 31, 31, 31, 31, 31, 31, 31, 31, 31, 31, 31, 31, 31, 3…
$ week_of_year <dbl> 53, 53, 53, 53, 53, 53, 53, 53, 53, 53, 53, 53, 53, 53, 5…
$ month        <dbl> 12, 12, 12, 12, 12, 12, 12, 12, 12, 12, 12, 12, 12, 12, 1…
$ quarter      <int> 4, 4, 4, 4, 4, 4, 4, 4, 4, 4, 4, 4, 4, 4, 4, 4, 4, 4, 4, …
$ year         <dbl> 2004, 2004, 2004, 2004, 2004, 2004, 2004, 2004, 2004, 200…
Although, there are only 2 variables, there are over 120,000 rows of data. That’s non-negligible.

Using python

This is the code from the original post.

import numpy as np
import pandas as pd
import matplotlib.pyplot as plt

py_df = pd.read_csv("../../../raw_data/AEP_hourly.csv", index_col = [0], parse_dates = [0])
py_df.tail()
                      AEP_MW
Datetime                    
2018-01-01 20:00:00  21089.0
2018-01-01 21:00:00  20999.0
2018-01-01 22:00:00  20820.0
2018-01-01 23:00:00  20415.0
2018-01-02 00:00:00  19993.0
#plt.plot(df0)
split_date = '01-jan-2016'
py_df_train = py_df.loc[py_df.index <= split_date].copy()
py_df_test = py_df.loc[py_df.index > split_date].copy()

The author of the python blog first created a train / test set then created a function to add the variables then applied that function to both sets. This is a very valid way of doing things when steps include normalizing and/or scaling data before applying our ML algorithms as we don’t want any leakage from our training set into our testing set.

# Create features of df
def create_features(df, label = None): 
  df['date'] = df.index 
  df['hour'] = df['date'].dt.hour
  df['day_of_week'] = df['date'].dt.dayofweek
  df['day_of_year'] = df['date'].dt.dayofyear 
  df['day_of_month'] = df['date'].dt.day 
  df['week_of_year'] = df['date'].dt.isocalendar().week 
  df['month'] = df['date'].dt.month 
  df['quarter'] = df['date'].dt.quarter 
  df['year'] = df['date'].dt.year
  
  X = df[['hour', 'day_of_week', 'day_of_year', 'day_of_month', 'week_of_year', 'month', 'quarter', 'year']]
  
  if label: 
    y = df[label]
    return X, y
  
  return X

Compare this way of constructing variables to the much easier and more elegant tidyverse’s way of cleaning and creating variables. The dplyr package really makes it painless to wrangle data.

Spliting the data into a training and testing set

Using R

Rsample is the tidymodel package that deals with creating training and testing sets. There are really many methods available to do this, but we stick to the same methods provided in the original blog post. There are out-of-the-box methods to deal with timeseries like in this case.

library(rsample)
prop_split = 1 - (nrow(df |> filter(Datetime > "2016-01-01")) / nrow(df))
df_split <- initial_time_split(df |> arrange(Datetime), prop = prop_split)
df_train <- training(df_split)
df_test <- testing(df_split)

Using Python

py_x_train, py_y_train = create_features(py_df_train, label = "AEP_MW")
py_x_test, py_y_test =   create_features(py_df_test, label = "AEP_MW")
#When running xgboost, I got an issue with one of the type of the variable.  
# Let's fix this. 
py_x_train.info()
<class 'pandas.core.frame.DataFrame'>
DatetimeIndex: 98594 entries, 2004-12-31 01:00:00 to 2015-01-02 00:00:00
Data columns (total 8 columns):
 #   Column        Non-Null Count  Dtype 
---  ------        --------------  ----- 
 0   hour          98594 non-null  int32 
 1   day_of_week   98594 non-null  int32 
 2   day_of_year   98594 non-null  int32 
 3   day_of_month  98594 non-null  int32 
 4   week_of_year  98594 non-null  UInt32
 5   month         98594 non-null  int32 
 6   quarter       98594 non-null  int32 
 7   year          98594 non-null  int32 
dtypes: UInt32(1), int32(7)
memory usage: 3.9 MB
py_x_train = py_x_train.astype(np.int64)
py_x_test = py_x_test.astype(np.int64)
py_x_train.info()
<class 'pandas.core.frame.DataFrame'>
DatetimeIndex: 98594 entries, 2004-12-31 01:00:00 to 2015-01-02 00:00:00
Data columns (total 8 columns):
 #   Column        Non-Null Count  Dtype
---  ------        --------------  -----
 0   hour          98594 non-null  int64
 1   day_of_week   98594 non-null  int64
 2   day_of_year   98594 non-null  int64
 3   day_of_month  98594 non-null  int64
 4   week_of_year  98594 non-null  int64
 5   month         98594 non-null  int64
 6   quarter       98594 non-null  int64
 7   year          98594 non-null  int64
dtypes: int64(8)
memory usage: 6.8 MB

Modeling

Using R

Again this is a very straightforward xgboost application to a dataset. No fine tuning of models, recipe, etc.

library(parsnip)
model_xgboost <- boost_tree(stop_iter = 50L, trees=1000L) |> 
  set_engine("xgboost") |>
  set_mode("regression")
  
fit_xgboost <- model_xgboost |> 
  fit(AEP_MW ~., data = df_train %>% select(-Datetime))
fit_xgboost
parsnip model object

##### xgb.Booster
raw: 4.7 Mb 
call:
  xgboost::xgb.train(params = list(eta = 0.3, max_depth = 6, gamma = 0, 
    colsample_bytree = 1, colsample_bynode = 1, min_child_weight = 1, 
    subsample = 1), data = x$data, nrounds = 1000L, watchlist = x$watchlist, 
    verbose = 0, early_stopping_rounds = 50L, nthread = 1, objective = "reg:squarederror")
params (as set within xgb.train):
  eta = "0.3", max_depth = "6", gamma = "0", colsample_bytree = "1", colsample_bynode = "1", min_child_weight = "1", subsample = "1", nthread = "1", objective = "reg:squarederror", validate_parameters = "TRUE"
xgb.attributes:
  best_iteration, best_msg, best_ntreelimit, best_score, niter
callbacks:
  cb.evaluation.log()
  cb.early.stop(stopping_rounds = early_stopping_rounds, maximize = maximize, 
    verbose = verbose)
# of features: 8 
niter: 1000
best_iteration : 1000 
best_ntreelimit : 1000 
best_score : 242.3155 
best_msg : [1000]   training-rmse:242.315489 
nfeatures : 8 
evaluation_log:
     iter training_rmse
    <num>         <num>
        1    11175.8839
        2     7906.5875
---                    
      999      242.5272
     1000      242.3155

Using Python

from xgboost.sklearn import XGBRegressor
py_xgboost_mod = XGBRegressor(n_estimator = 1000, early_stopping_rounds = 50)
py_xgboost_mod.fit(py_x_train, py_y_train, 
                   eval_set = [(py_x_train, py_y_train), (py_x_test, py_y_test)], 
                   verbose = True)
XGBRegressor(base_score=None, booster=None, callbacks=None,
             colsample_bylevel=None, colsample_bynode=None,
             colsample_bytree=None, device=None, early_stopping_rounds=50,
             enable_categorical=False, eval_metric=None, feature_types=None,
             gamma=None, grow_policy=None, importance_type=None,
             interaction_constraints=None, learning_rate=None, max_bin=None,
             max_cat_threshold=None, max_cat_to_onehot=None,
             max_delta_step=None, max_depth=None, max_leaves=None,
             min_child_weight=None, missing=nan, monotone_constraints=None,
             multi_strategy=None, n_estimator=1000, n_estimators=None,
             n_jobs=None, num_parallel_tree=None, ...)
In a Jupyter environment, please rerun this cell to show the HTML representation or trust the notebook.
On GitHub, the HTML representation is unable to render, please try loading this page with nbviewer.org.

Features importance

Using R

2 ways to do this … (actually more than 2 ways, but here are 2 main ways.). First one is a straight table using the xgboost library itself.

library(xgboost)
xgb.importance(model = fit_xgboost$fit)
        Feature        Gain       Cover    Frequency
         <char>       <num>       <num>        <num>
1:  day_of_year 0.361826849 0.455387001 0.2800303942
2:         hour 0.336853508 0.125331328 0.2374139102
3:         year 0.120130183 0.129691117 0.2000679018
4:  day_of_week 0.105250961 0.073258066 0.1489636887
5: week_of_year 0.047082964 0.097216236 0.0462379151
6: day_of_month 0.027801172 0.116483820 0.0864293336
7:        month 0.001054364 0.002632432 0.0008568565
#detach(xgboost)

And also a graphic way.

library(vip)
fit_xgboost %>%
  vip(geom = "point")

Using python

from xgboost import plot_importance, plot_tree
_ = plot_importance(py_xgboost_mod, height=0.9)

I am a bit confused here in the output of the python graph with F-score vs the output of the R graph with importance.

Checking predictions and evaluating models

Using R

Graphing predicted power output vs actual power output could be a first way to see how our model fares in its predictions. So let’s graph our datetime vs power ouput for both actual and predicted.

library(tibble)  # for the add_column 
library(parsnip)
df_test1 <- add_column(df_test,  predict(fit_xgboost, new_data = df_test)) 
ggplot(df_test1, aes(x= Datetime, y = AEP_MW)) + 
  geom_line(color = "blue") + 
  geom_line(aes(y = .pred), color = "yellow", alpha = 0.5) + 
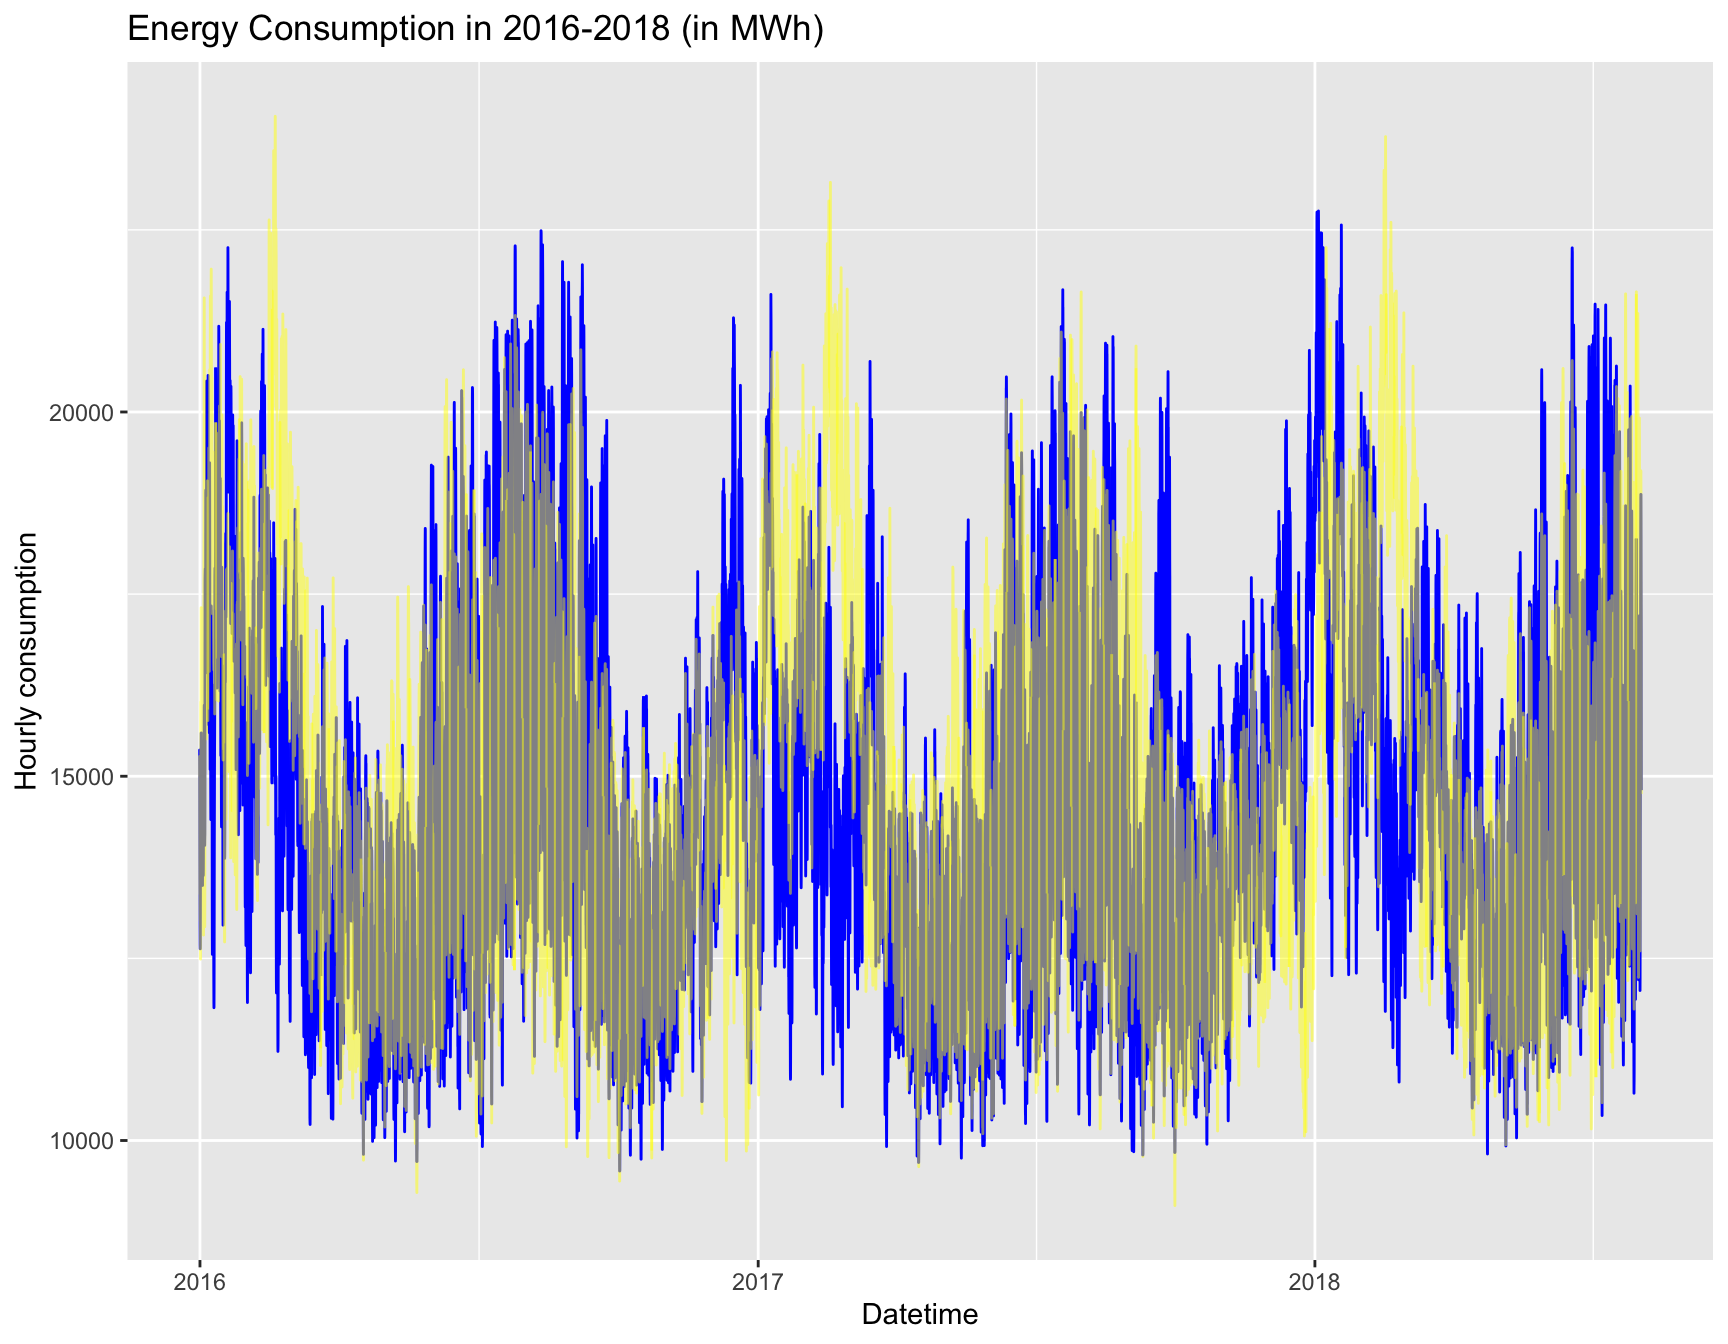
  labs(title = "Energy Consumption in 2016-2018 (in MWh)", y = "Hourly consumption")
Figure 2: Actual Vs Predicted power consumption for 2016-2018

We can already see that we are not really modeling well the peaks and through.
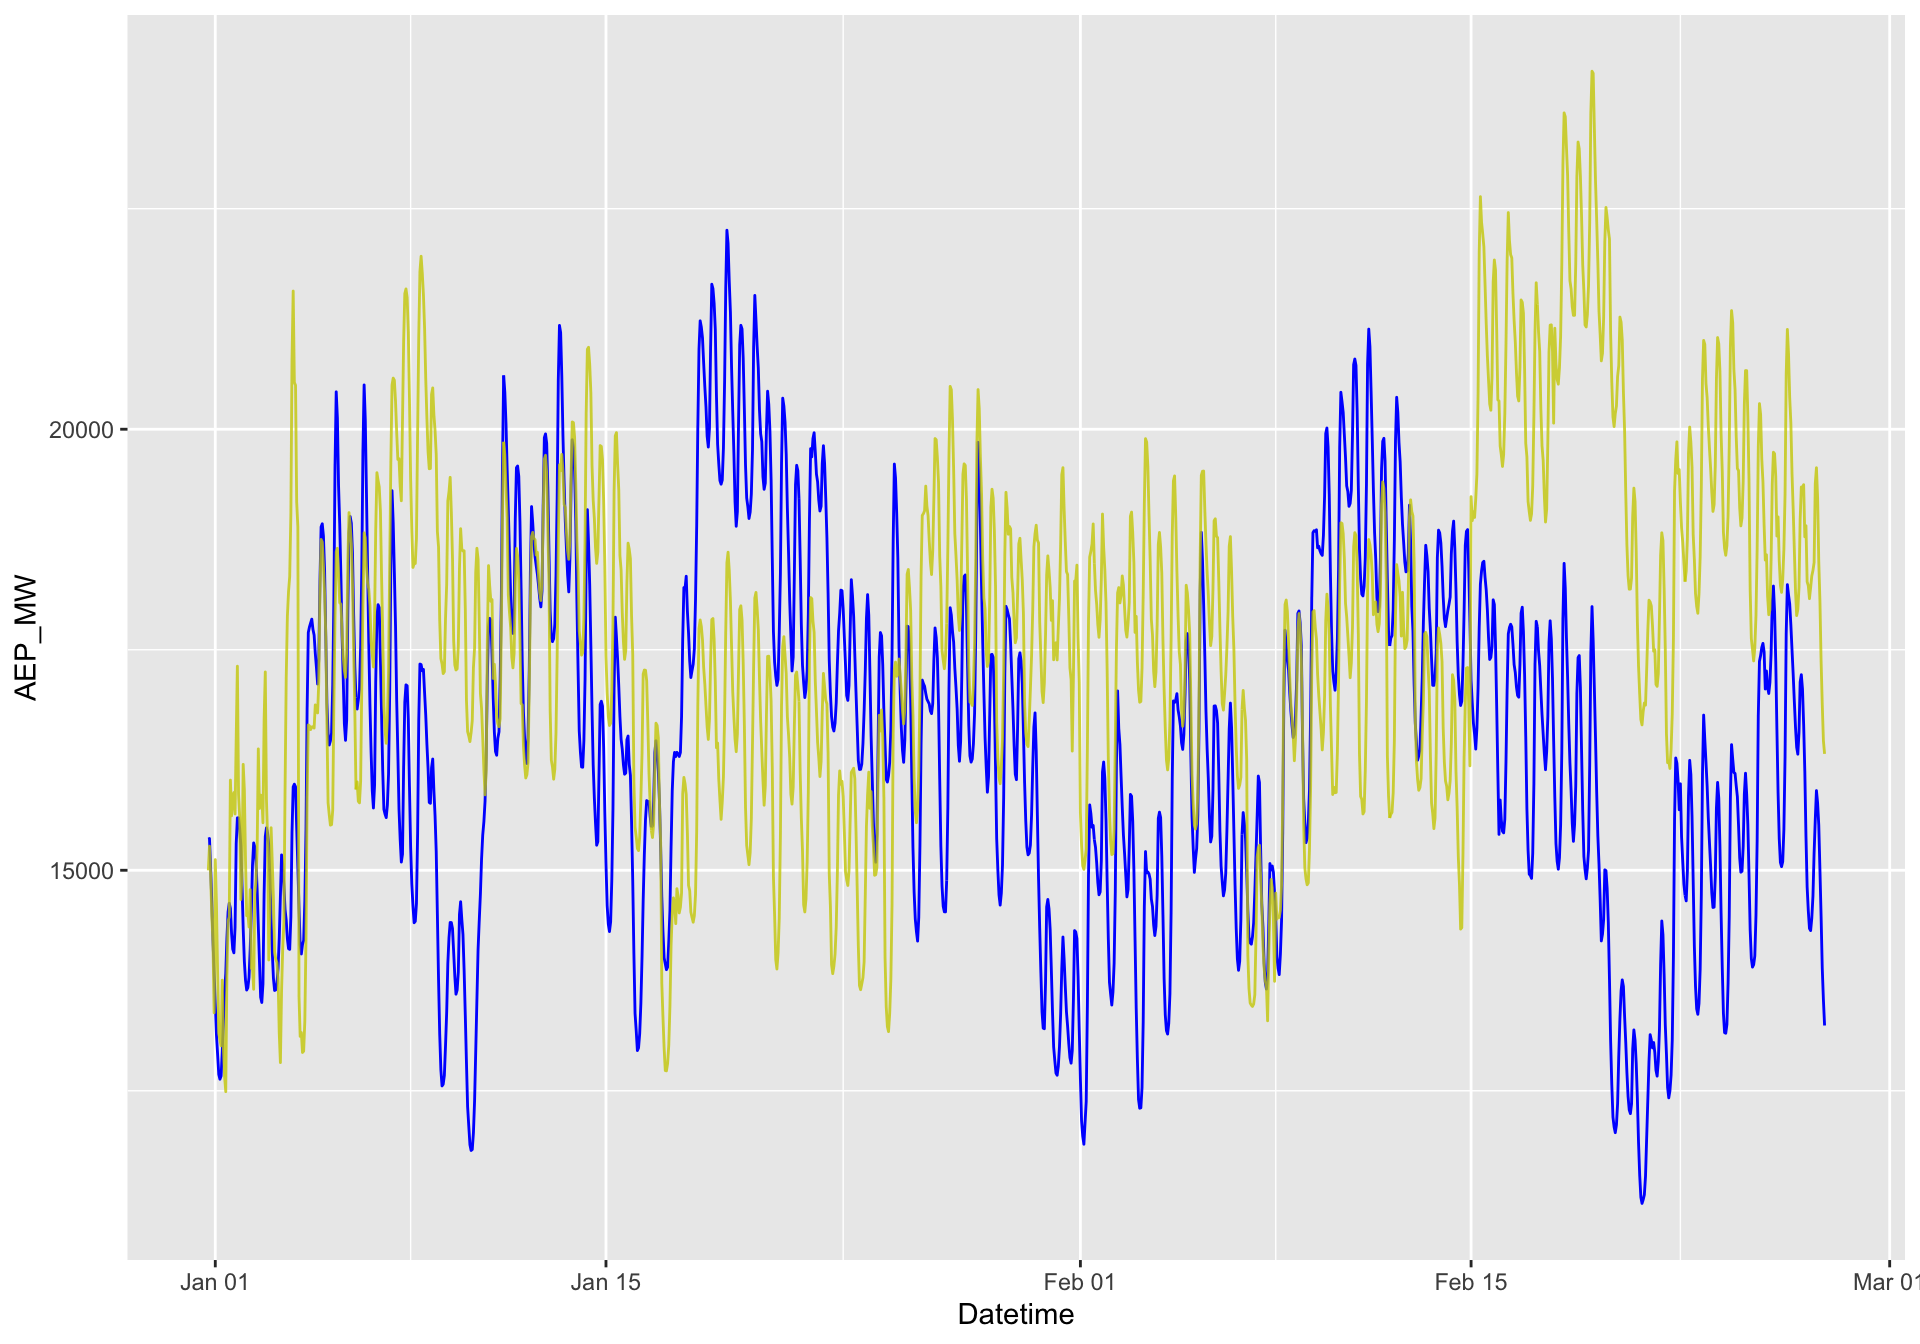
We could get slightly more granular and try to see whats going on.

ggplot(df_test1 %>% filter(Datetime > "2016-01-01" & Datetime < "2016-02-28"), aes(x= Datetime, y = AEP_MW)) + 
  geom_line(color = "blue") + 
  geom_line(aes(y = .pred), color = "yellow3", alpha = 0.8)
Figure 3: Actual Vs Predicted power consumption

We are clearly off there on the second half of February.

Now, we can use the yardstick package to get numerical values to assess our model on the test set.

library(yardstick)
# calculating the RMSE (root mean square error)
rmse(df_test1, truth = AEP_MW, estimate = .pred, na_rm = TRUE)
# A tibble: 1 × 3
  .metric .estimator .estimate
  <chr>   <chr>          <dbl>
1 rmse    standard       2067.
# calculating the MAE (mean absolute error)
mae(df_test1, truth = AEP_MW, estimate = .pred)
# A tibble: 1 × 3
  .metric .estimator .estimate
  <chr>   <chr>          <dbl>
1 mae     standard       1495.
# calculating the MAPE (mean absolute percent error)
mape(df_test1, truth = AEP_MW, estimate = .pred)
# A tibble: 1 × 3
  .metric .estimator .estimate
  <chr>   <chr>          <dbl>
1 mape    standard        10.0
# actually much easier to use the metric_set() function !
xgboost_mod_metrics <- metric_set(rmse, mae, mape)
xgboost_mod_metrics(df_test1, truth = AEP_MW, estimate = .pred) 
# A tibble: 3 × 3
  .metric .estimator .estimate
  <chr>   <chr>          <dbl>
1 rmse    standard      2067. 
2 mae     standard      1495. 
3 mape    standard        10.0